
How Can We Help?
Charts
Graphical Charts for Monitored Rooms
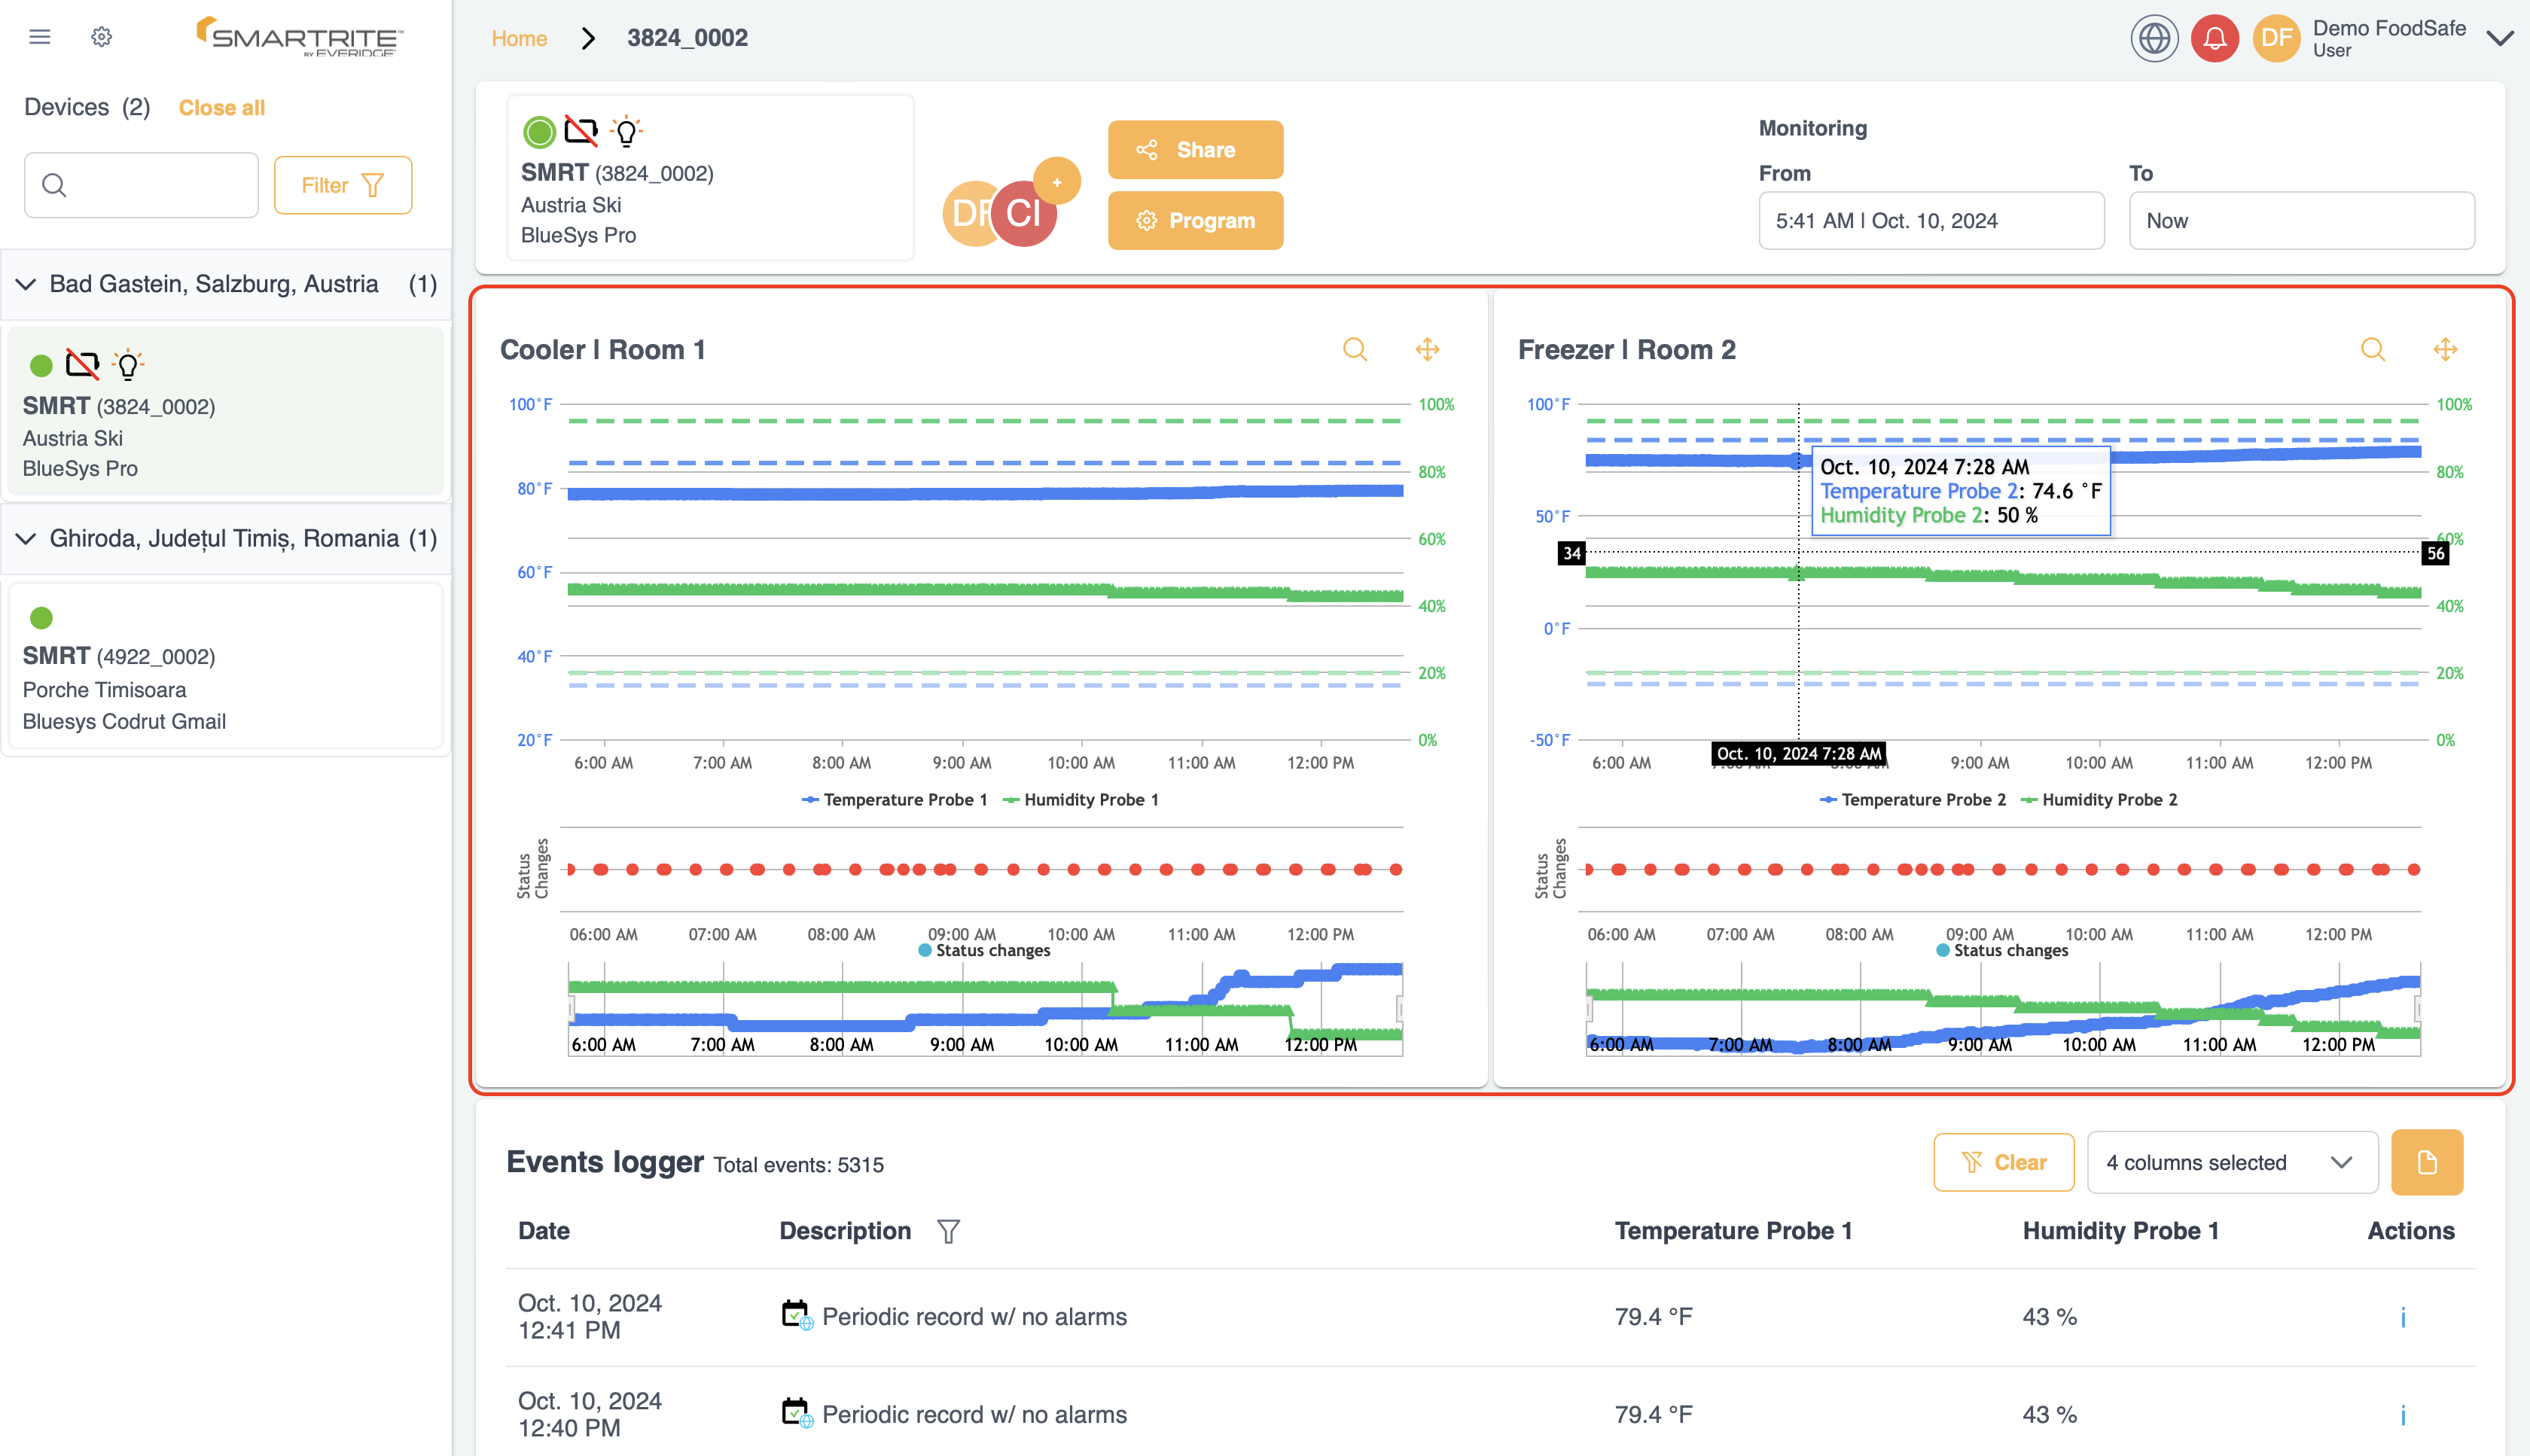
- Below the top section, you will find Graphical Charts for each room monitored by the device.
- These charts provide a visual representation of key metrics, including:
- Temperature Trends: Track temperature changes over time in each monitored room.
- Alarms and Periodic Events: Easily identify alarms triggered in the past, as well as any periodic activities the device has performed.
- The visual aspect of these charts allows for a clearer understanding of environmental data and helps identify trends or anomalies at a glance.