
How Can We Help?
Dashboard Explanation
Left Panel: Devices Grouped by Location
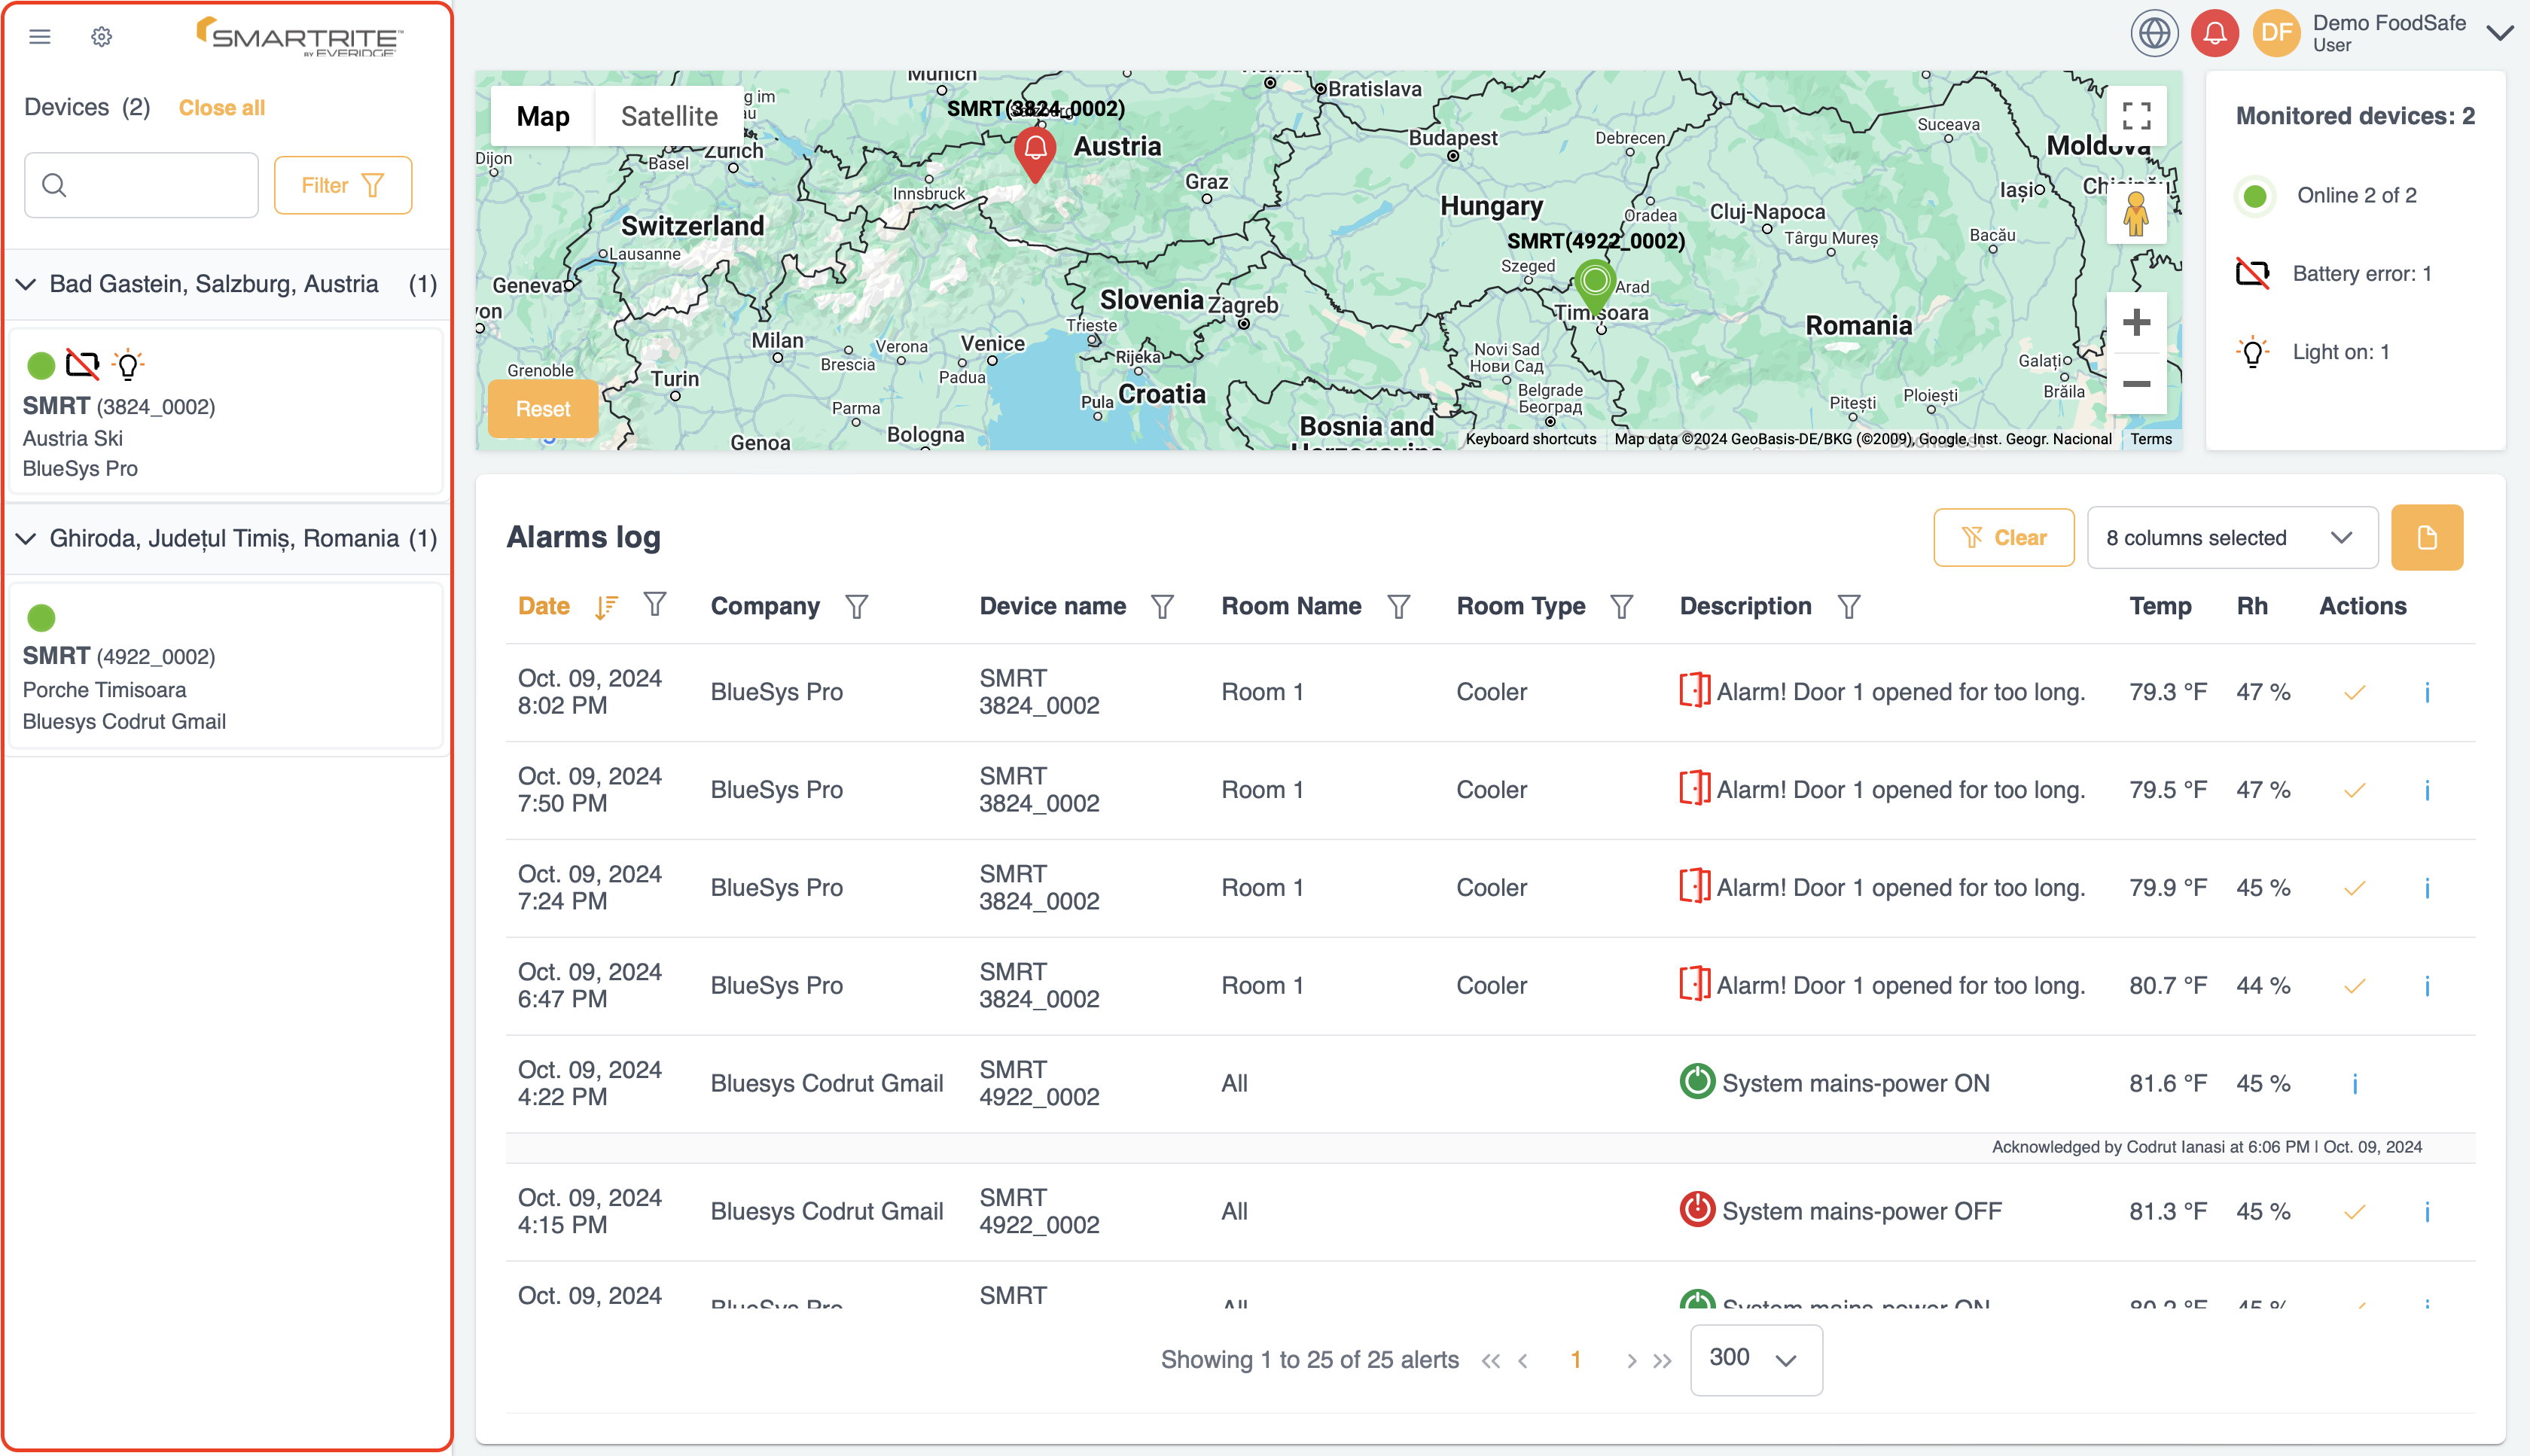
On the left-hand side of your dashboard, you will see a list of all your devices organized by Location. This allows you to:
- Quickly Navigate through different kitchens and see which devices are associated with each one.
- Select Specific Location to focus on a particular setup and manage the devices within that group.
This grouping feature helps you efficiently manage multiple devices across different locations or organizational units.
2. Center Section: Map Overview
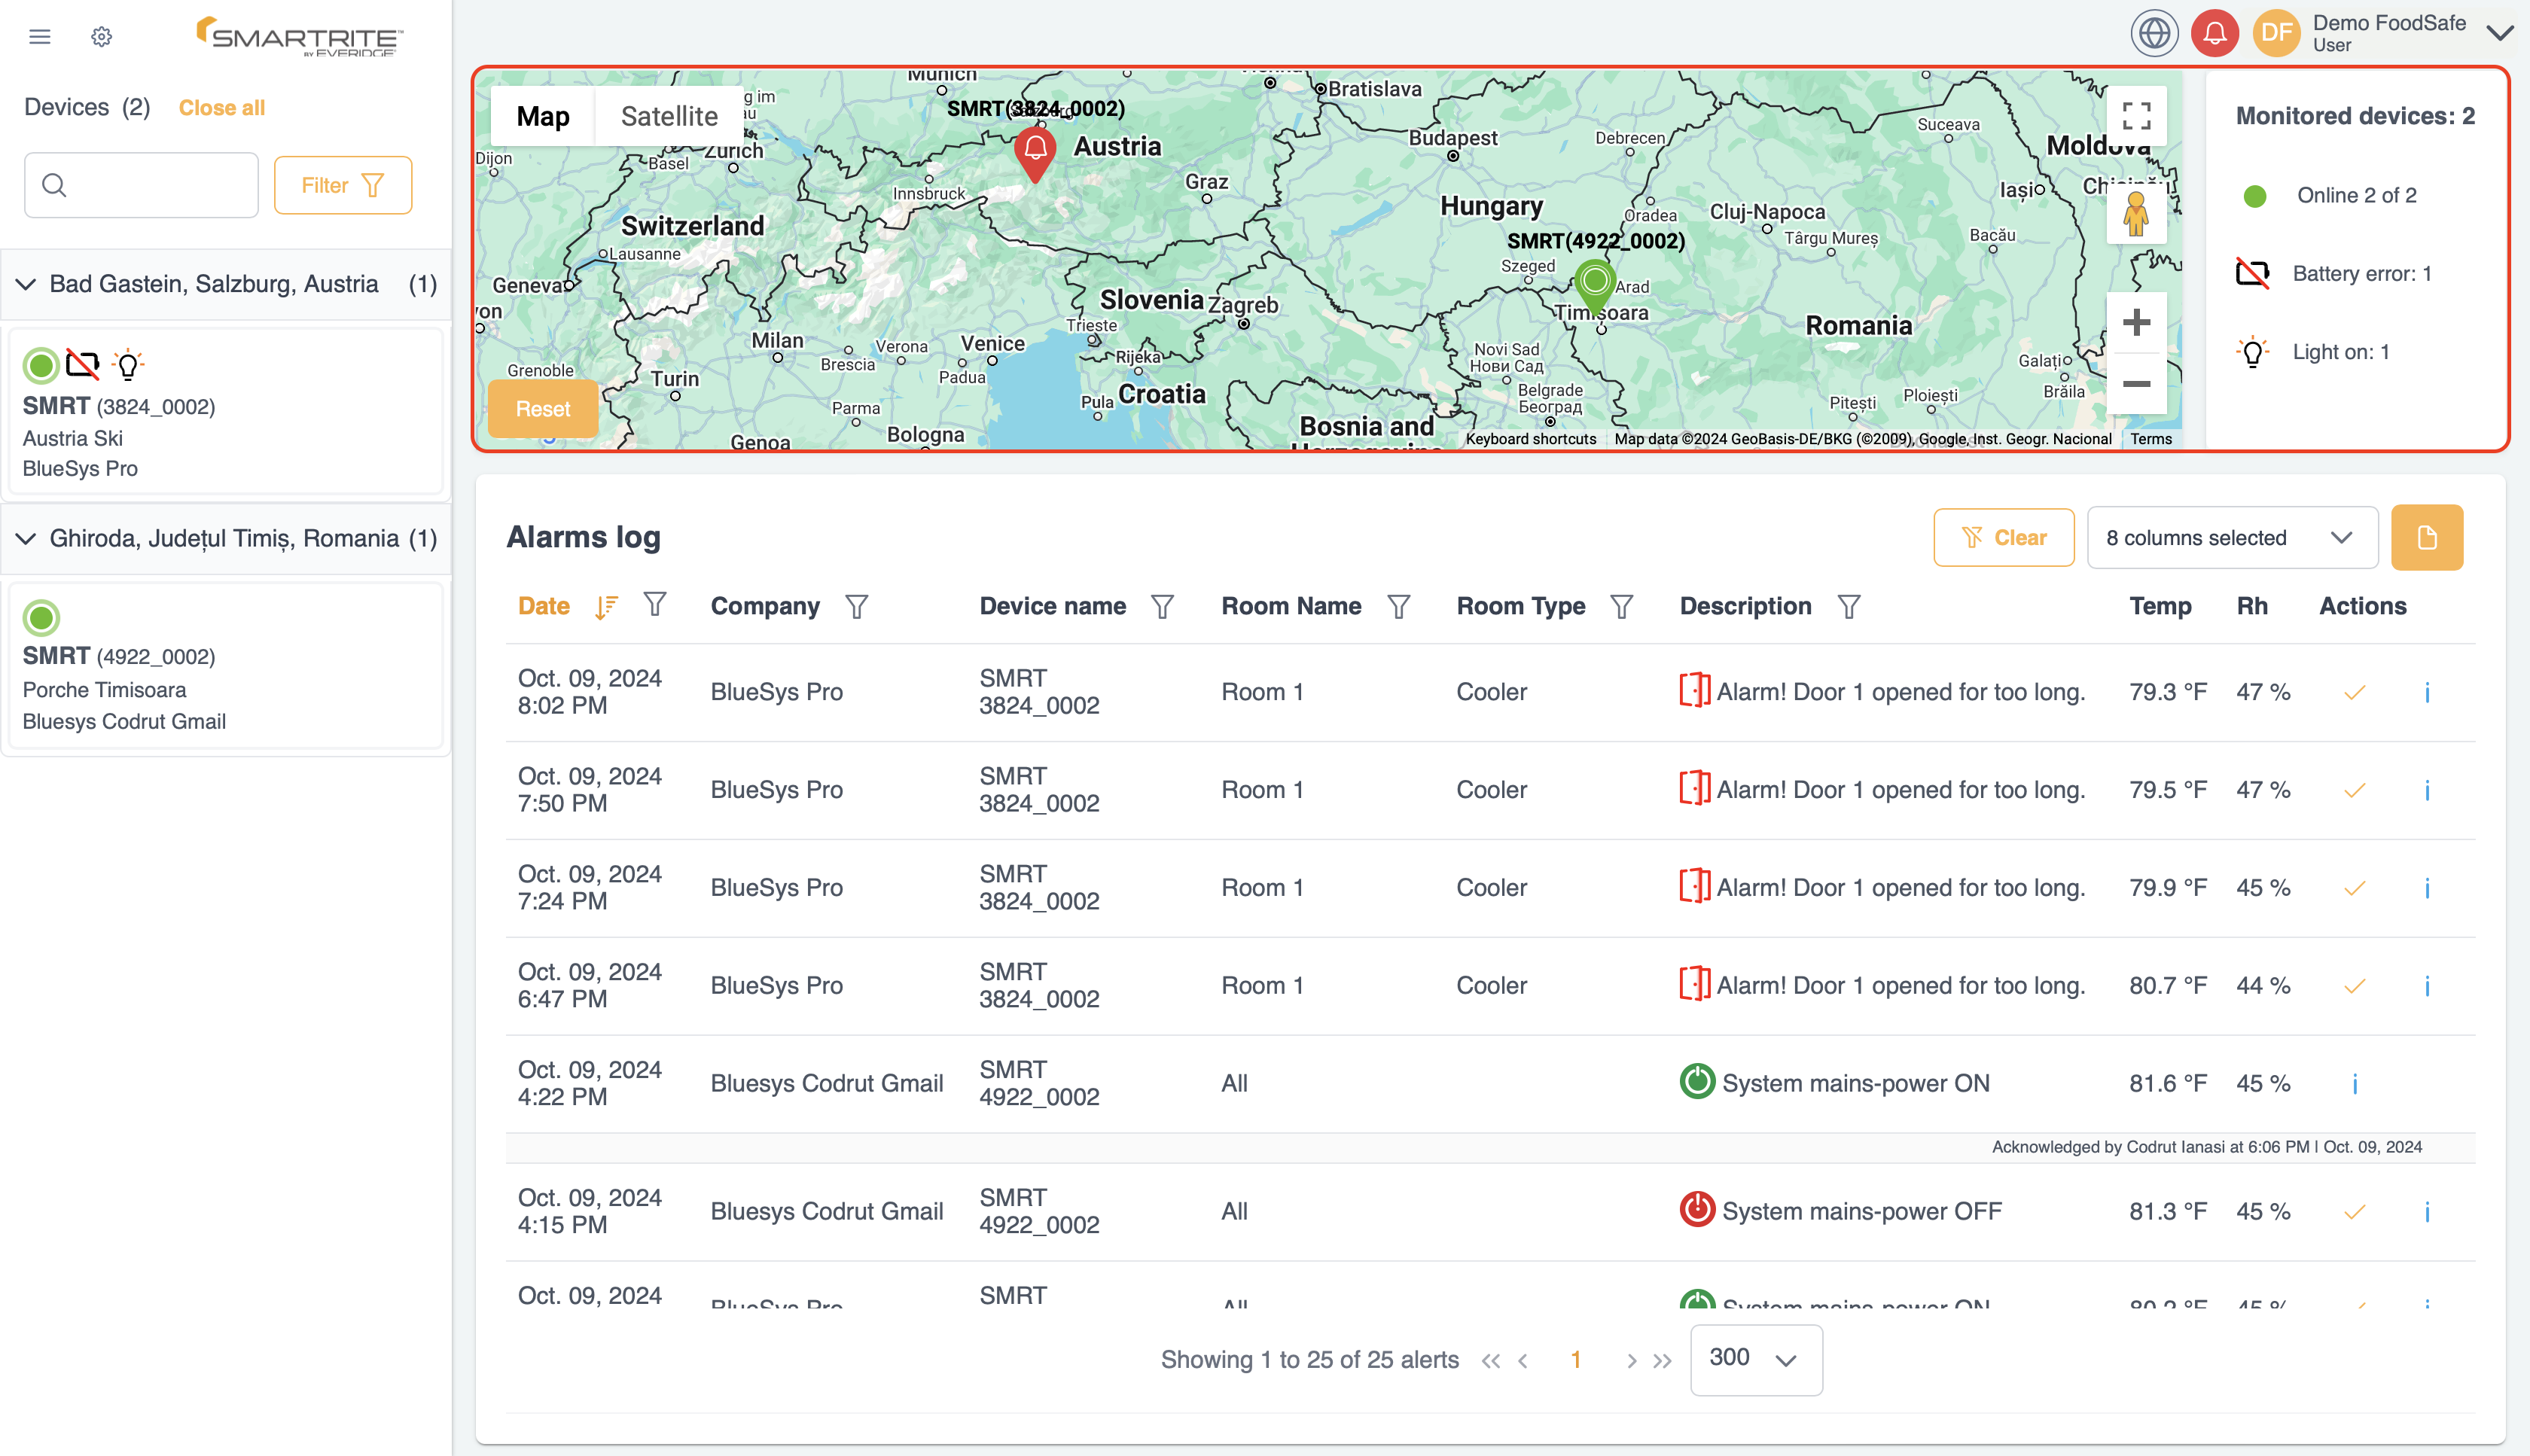
In the middle of the dashboard, you’ll find a Map that gives you a comprehensive overview of your device network:
- Device Locations: All your devices are displayed on the map, helping you visualize their physical locations.
- Better Overview: This visual representation makes it easier to understand the placement and distribution of devices at a glance, especially useful for larger or distributed setups.
3. Right Panel: Statistics
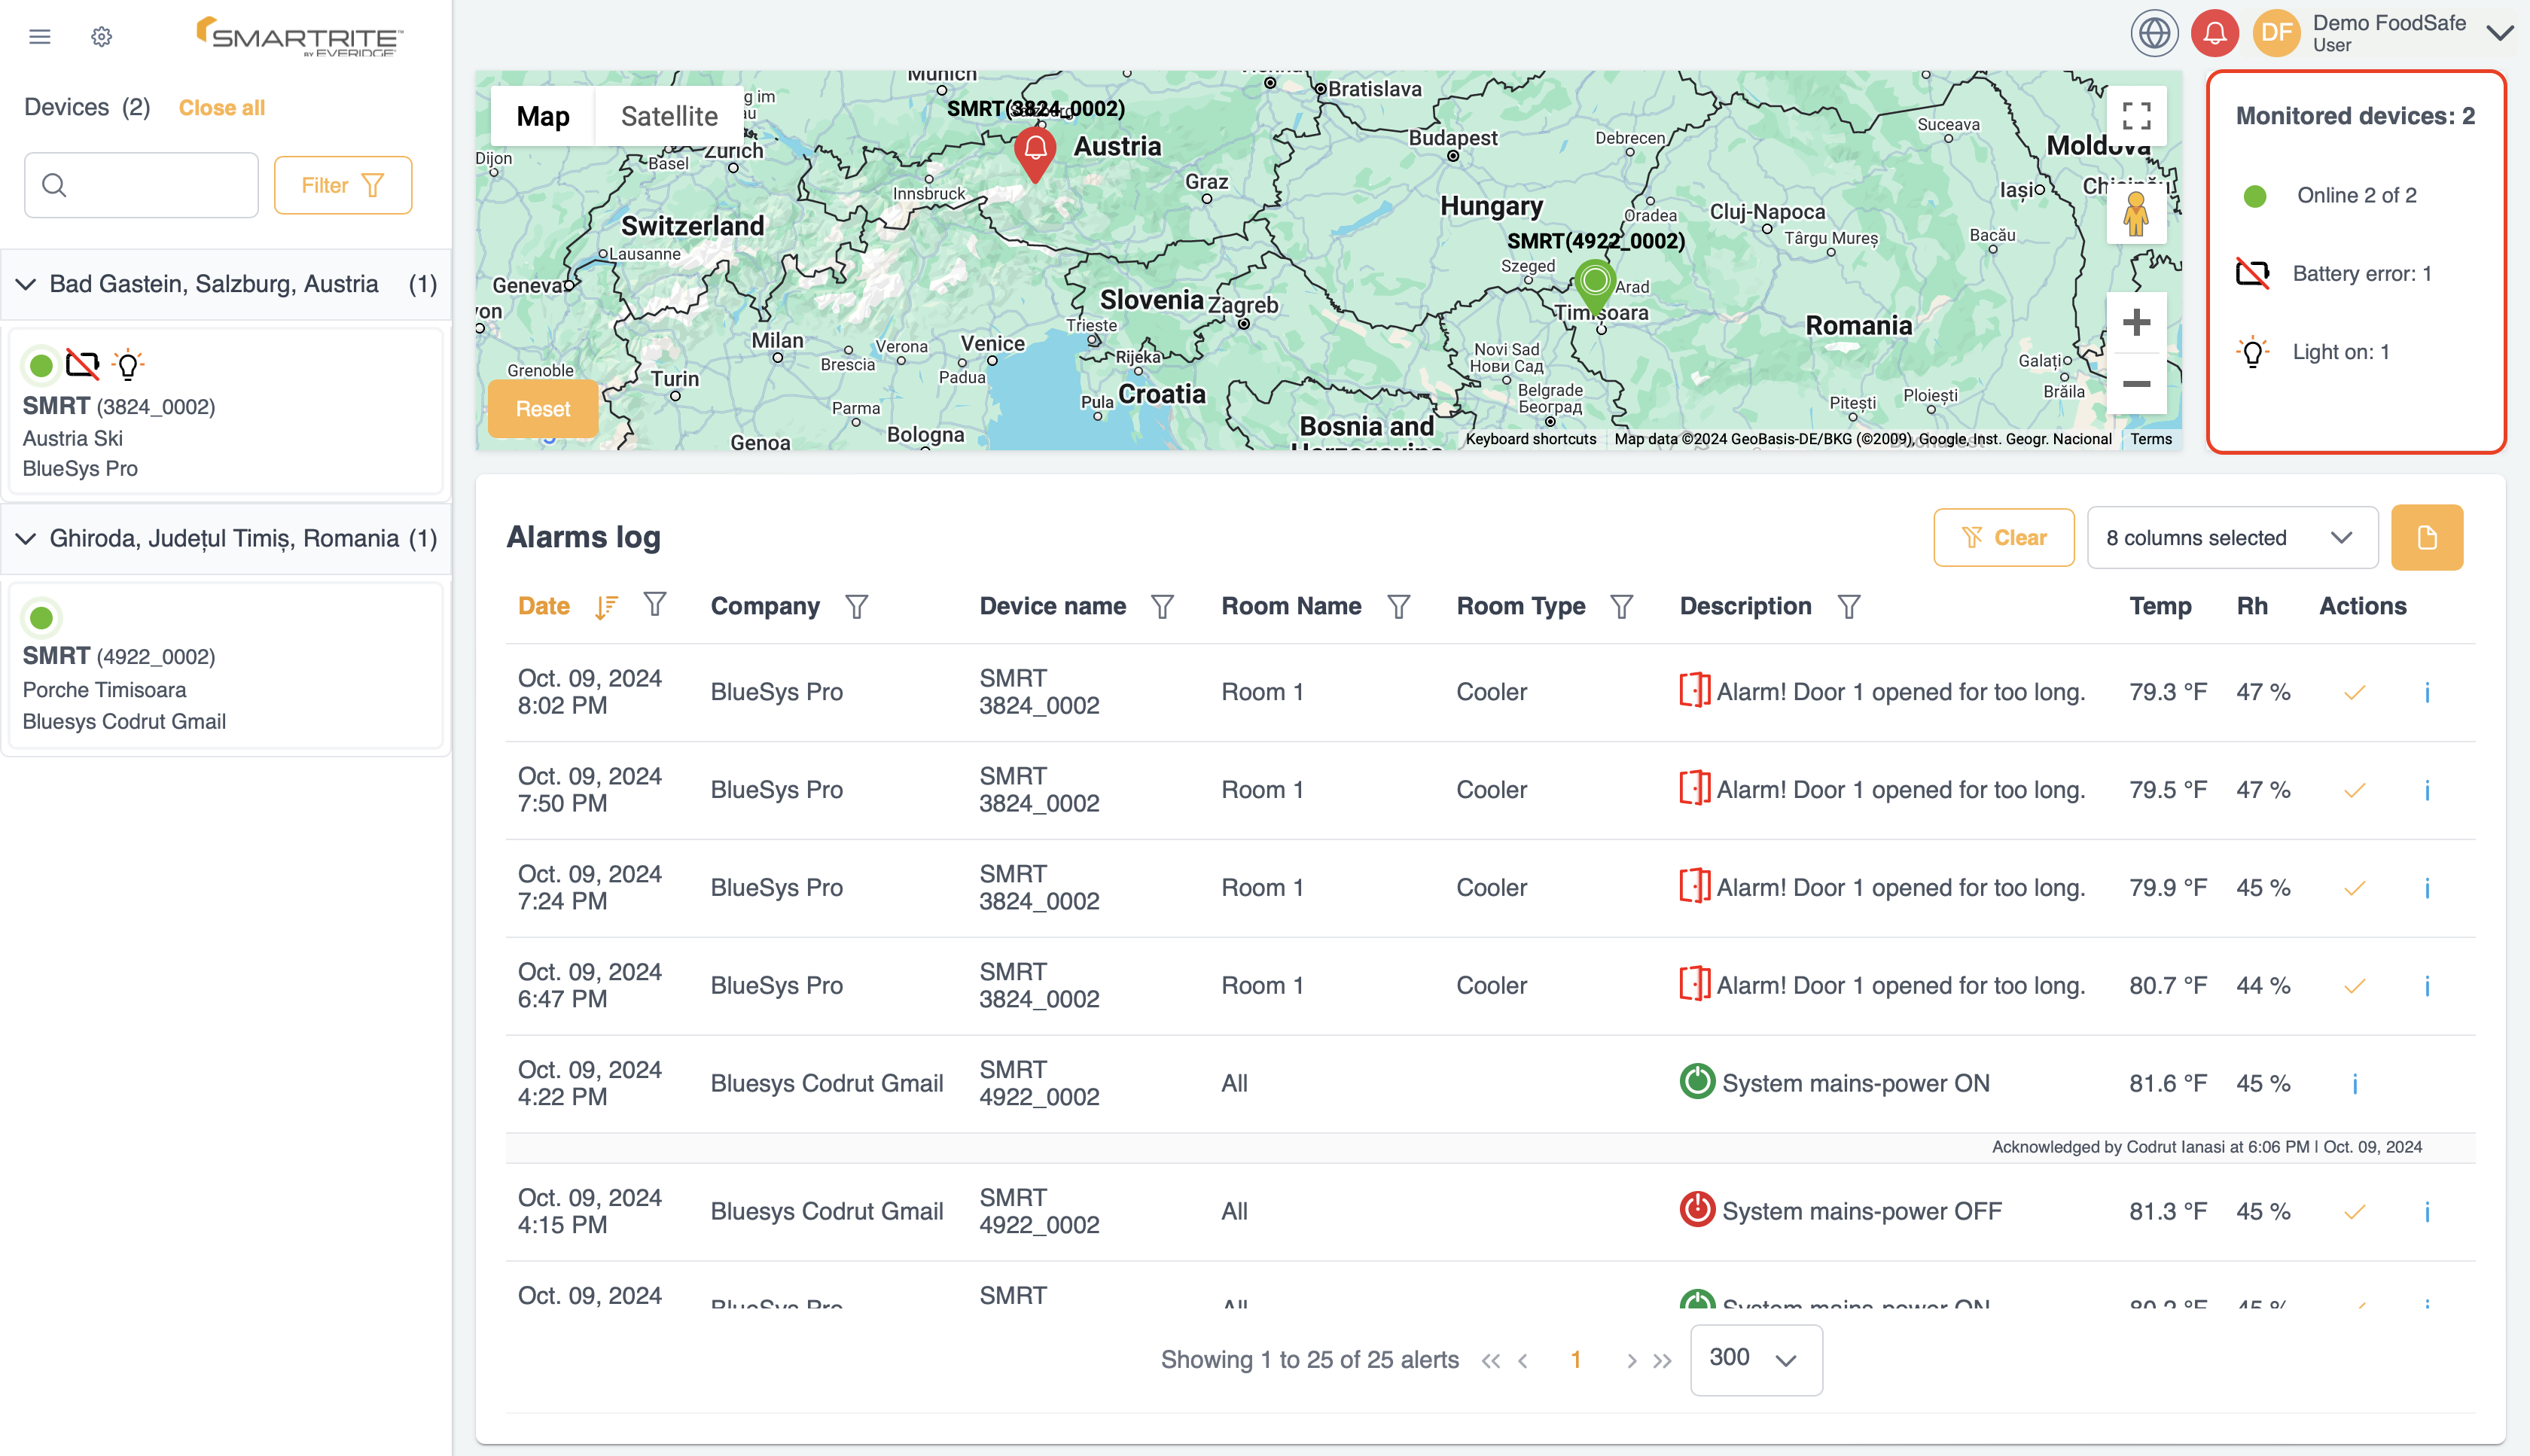
To the right of the map, you’ll find the Statistics section:
- General Information: This area provides aggregated data and key metrics about your devices and their activity.
- Device Health and Usage Insights: Here, you can view summaries such as device statuses, performance statistics, and usage analytics, giving you valuable insights into your network’s overall health.
4. Bottom Section: Alarm Log
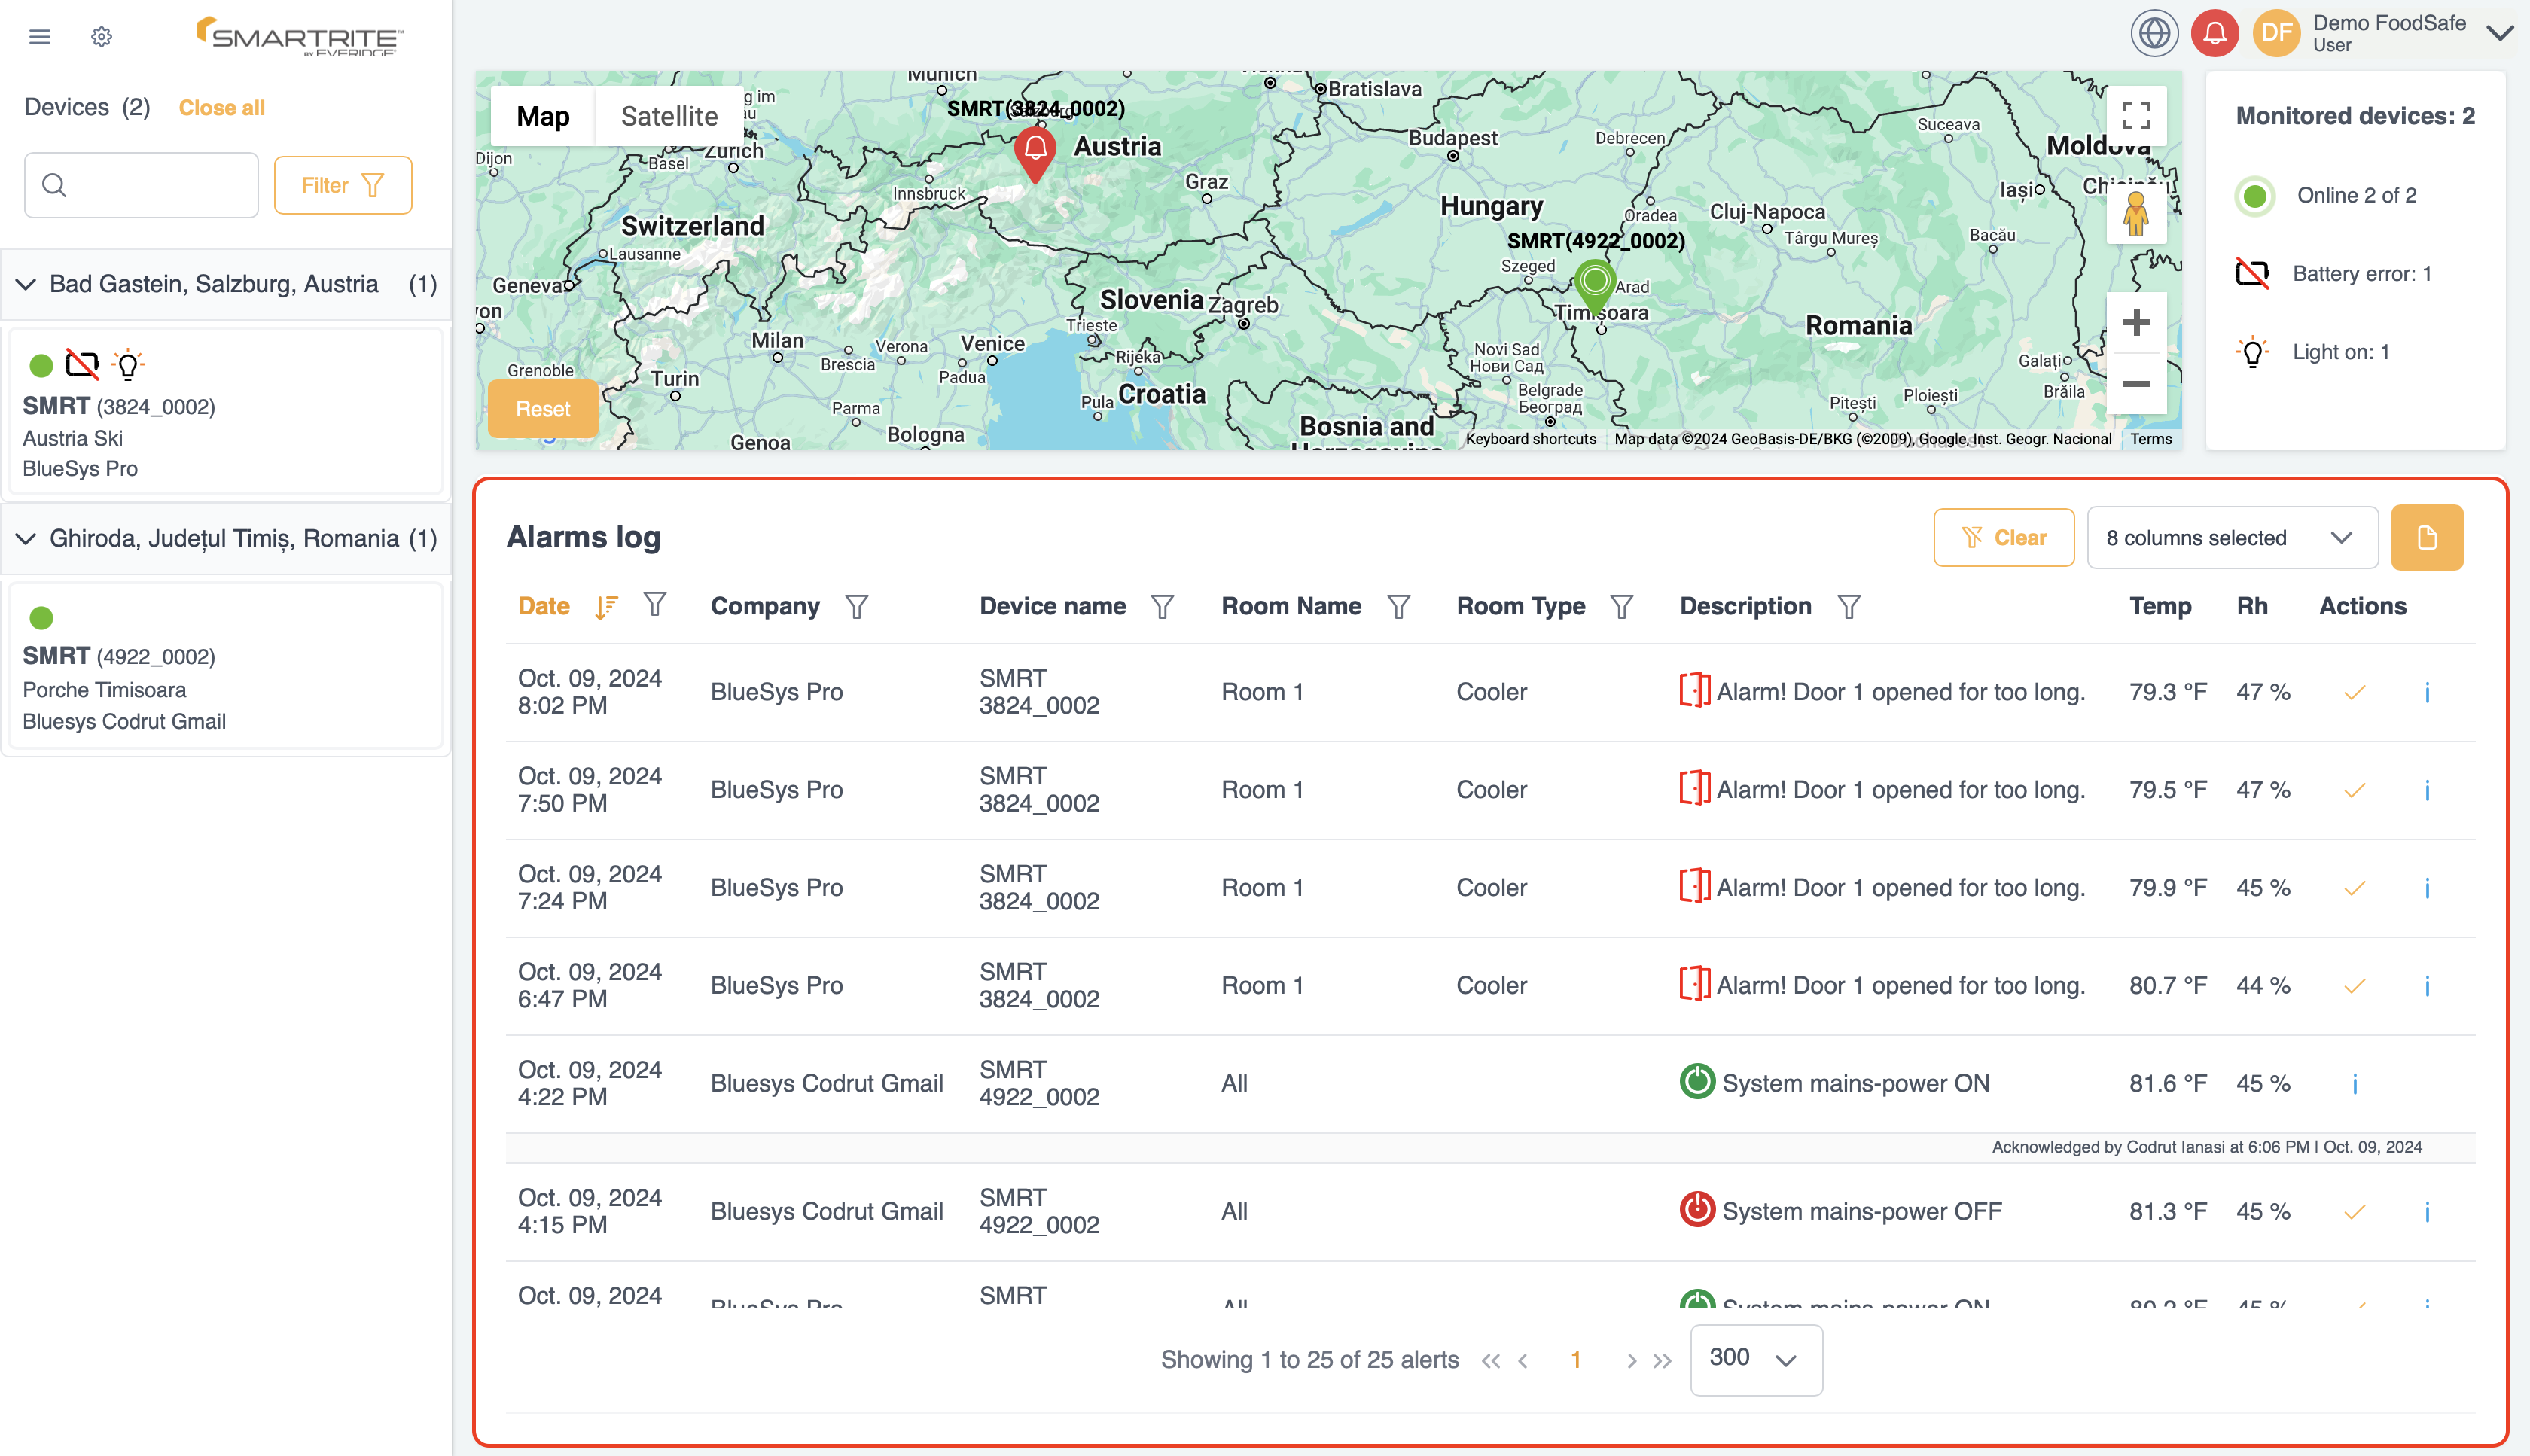
Below the map and statistics, you’ll find the Alarm Log:
- Centralized Log of Alarms: This feature collects and displays all the alarms generated by your devices in the recent period.
- Data Filtering and Ordering: You can filter alarms by different criteria—such as date, severity, or type—and order them accordingly, allowing for efficient monitoring and troubleshooting.
- Quick Response to Issues: This centralized view of alarms helps you address any issues promptly, minimizing potential disruptions.